Process & Energy Auditing
We measure before we recommend. Every finding carries a number, a cost and a payback period.
Process & Energy Auditing
Process and energy audits that pay for themselves
Overview
Most operating dairies are paying for the same three things without seeing them: steam that never reaches the process, refrigeration that runs at the wrong suction pressure, and product that leaves in the drain. An audit's job is to put a rupee figure on each of them.
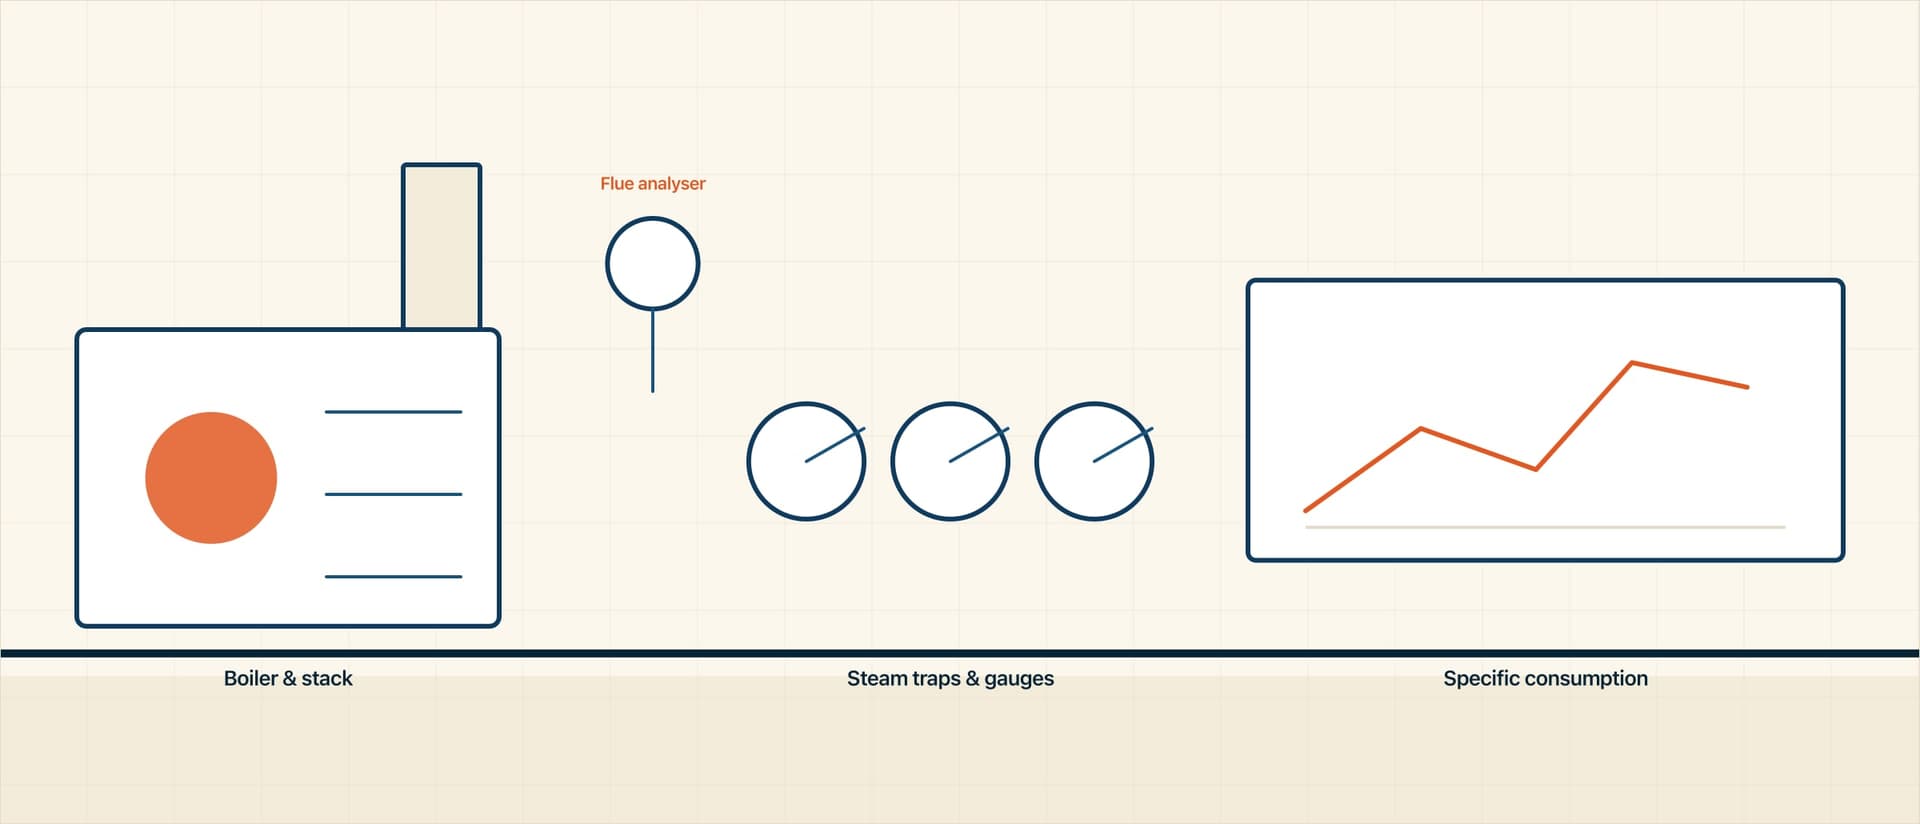
We instrument the plant during a normal production shift rather than a staged demonstration. Flue gas analysis and condensate recovery on the boiler side, suction and discharge pressures and approach temperatures on the refrigeration side, leak survey and pressure profile on compressed air, and a full water and effluent balance.
On the process side we track milk losses through line drainage, rinse-out, CIP first-flush, cream and whey handling and packing rejections. In most plants the total is between 0.5 and 1.5 per cent of throughput, which at any meaningful capacity is a larger number than the energy bill.
The deliverable is a costed action list ranked by payback, separating what can be fixed with operating discipline this month from what needs capital next year. Where you implement, we verify the saving against the same measurement method.
What’s included
Thermal audit
Boiler efficiency by direct and indirect method, flue gas analysis, condensate recovery, steam distribution losses, trap survey and insulation survey with surface temperature mapping.
Refrigeration audit
Compressor specific power, suction and discharge pressure profile, condenser approach, ice bank utilisation, chilled water temperature spread and cold room heat ingress.
Electrical and utility audit
Load profile, power factor, motor loading, pump and fan operating points against their curves, and compressed air leak survey with quantified loss.
Process loss audit
Milk and product loss through drainage, rinse, CIP first flush, separator desludging, packing rejection and returns, expressed as a percentage of intake and as annual value.
Water and effluent
Water balance across the plant, recovery opportunities from condensate and final rinse, and effluent load characterisation feeding into ETP loading.
Costed action plan
Findings ranked by simple payback, split into no-cost operating changes, low-cost fixes and capital proposals, each with the assumption behind the saving stated.
Typical capacity range
| Capacity | Typical configuration | Notes |
|---|---|---|
| Focused audit: 3 to 5 days on site | Single utility area, usually steam or refrigeration | For a specific complaint such as high furnace oil consumption or poor pull-down. |
| Full plant audit: 7 to 12 days on site | Complete utility and process loss audit | Covers thermal, refrigeration, electrical, water and process losses with a consolidated report. |
| Audit with implementation support | Audit plus execution and verification | We stay engaged through implementation and re-measure to confirm the saving is real. |
Process flow
The sequence we design and commission against. Each stage carries its own specification, and nothing downstream is sized until the stage before it is fixed.
- 01BaselineBills, logs, production data
- 02InstrumentationMeters placed on live shift
- 03Thermal surveyBoiler, traps, insulation
- 04Refrigeration surveyPressures, approach, loading
- 05Loss trackingDrain, rinse, rejection
- 06AnalysisSpecific consumption benchmarking
- 07Action listCosted and ranked by payback
- 08VerificationRe-measure after implementation
- Baseline: Bills, logs, production data
- Instrumentation: Meters placed on live shift
- Thermal survey: Boiler, traps, insulation
- Refrigeration survey: Pressures, approach, loading
- Loss tracking: Drain, rinse, rejection
- Analysis: Specific consumption benchmarking
- Action list: Costed and ranked by payback
- Verification: Re-measure after implementation
Design basis
An audit compares your plant against the numbers below. Where you fall short, the gap becomes a costed line item with a stated payback.
| Parameter | Design value | Why it matters |
|---|---|---|
| Boiler efficiency, oil or gas | 82 – 88 % | By both direct and indirect method, measured on a live shift |
| Boiler efficiency, solid fuel | 70 – 78 % | Fuel moisture has a larger effect than most operators expect |
| Flue gas oxygen | 3 – 5 % | Excess air is the cheapest correction available in most plants |
| Stack temperature | ≤ 180 °C | Higher means recoverable heat is leaving the building |
| Condensate recovery | ≥ 80 % at ≥ 85 °C | Recovering it cold gives back a fraction of the value |
| Refrigeration specific power | 0.75 – 1.0 kW/TR | Ammonia plant at good practice, measured not nameplate |
| Chilled water ΔT | 4 – 5 °C | A low ΔT usually means over-pumping and wasted power |
| Compressed air leakage | < 5 % of generation | We commonly measure four times this on first audit |
| Process loss | ≤ 0.5 % of intake | Between 0.5 % and 1.5 % is what we usually find |
| Specific consumption | 25 – 40 kg steam, 15 – 25 kWh per 1,000 L | Your benchmark band depends on product mix |
These are standard design ranges, not project guarantees. Every figure is confirmed against your milk analysis, product specification and site conditions before it enters a DPR.
Utility requirements
Typical design basis. Utilities are sized from the process duty curve with diversity applied, so they are neither starved at peak nor oversized for the sake of it.
Measurement method
Fixed before implementation
Including how production volume and ambient conditions are normalised
Baseline period
A representative production month
Not a week chosen for a favourable result
Verification
Re-measured the same way afterwards
If the saving is not there, that is what the report says
Equipment we specify
Instruments used
- Flue gas analyser and infrared thermometer
- Ultrasonic flow meter and clamp-on power analyser
- Data-logging temperature and pressure sensors
- Ultrasonic leak detector for compressed air and steam traps
Typical findings
- Condensate not recovered or recovered at low temperature
- Refrigeration running at unnecessarily low suction pressure
- Compressed air leaks equal to a fifth of compressor output
- First-flush milk sent to drain instead of recovered
Outputs
- Specific energy consumption per litre processed
- Utility-wise cost breakdown against benchmark
- Costed action list with simple payback for each item
- Measurement and verification protocol for implemented items
Standards & compliance
Instrumented, not estimated
Flue gas analysis, ultrasonic flow, clamp-on power logging, data-logging temperature and pressure, and ultrasonic leak detection, all during normal production.
Measurement and verification
Every claimed saving carries its measurement method, its baseline, its normalisation basis and its assumptions in writing.
Reporting
Findings ranked by simple payback and split into no-cost operating changes, low-cost fixes and capital proposals, so the easy money can be taken this month.
Regulatory limits and standard numbers are confirmed against the current published text for your product and licence category at DPR stage.
Frequently asked
In plants that have not been audited recently, 8 to 18 per cent of utility cost is commonly available, and roughly half of that typically needs no capital at all. Process loss recovery is often worth more than the energy saving. We will not quote a figure for your plant before measuring it.
No. We instrument during normal running because a staged demonstration tells us nothing useful. The only requirement is access to the utility areas and the production logs, and a few short windows with the shift engineer.
We fix the measurement method and the baseline before the change is made, including how we will normalise for production volume and ambient conditions, then re-measure the same way afterwards. If the saving is not there, that is what the report says.
We can. Some clients take the action list to their own team or existing vendors, others ask us to specify, procure and supervise the fixes. Either way the verification method stays the same.
Planning a process & energy auditing project?
Send us the capacity, the product basket and the site location. We will tell you what the engineering actually involves before anyone quotes you for equipment.